Outgroup Homogeneity Bias
"They're all the same." Why we see our own group as wonderfully varied but lump members of other groups together as more alike than they really are.
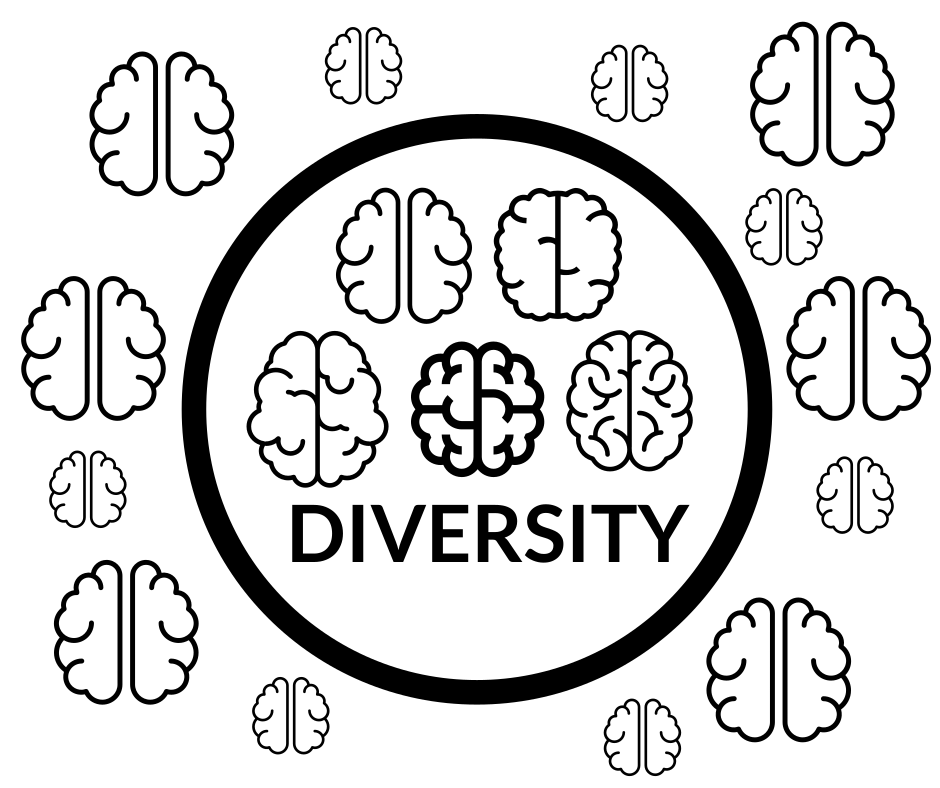
"We're all different, but they're all the same." That, in one line, is outgroup homogeneity bias: the tendency to see people in a group you don't belong to (the "outgroup") as more alike than they really are, while seeing your own group (the "ingroup") as rich in variety. It's a short step from there to stereotypes and misunderstandings, and it often travels with in-group favoritism, our habit of preferring our own side.
Two everyday examples:
Sports teamsYou support a team, and you know its fans are a mixed bunch from all walks of life. Fans of your rival, though? They all seem to have the same opinions, the same attitude, maybe even the same haircut. In reality their fan base is just as varied as yours.
NationalitiesYou're from Country A, and you know your country is full of different cultures, languages and customs. Country B, on the other hand, seems to have just one culture and one way of life, even though it may be every bit as diverse. You know your own side in detail and theirs only in outline.
Noticing this bias in yourself is a good first step to questioning your assumptions about other groups, understanding them better and leaning less on stereotypes.
The outgroup homogeneity effect shows up in many studies, but researchers still argue about how big it is, when it flips, and what causes it:
A small effectMullen and Hu pooled the early studies in a 1989 meta-analysis, and reviews of the research describe the effect as robust but small, and smaller still for artificial groups created in the lab than for real-world groups like nationalities or genders. It's a tilt in perception, not a blindfold.
It can run the other wayBernd Simon and Rupert Brown reported in 1987 that members of minority groups often see their own group as the more uniform one, perhaps because stressing "we're all in this together" builds solidarity when a group feels under threat. Later work found that people of all kinds can see their own group as alike on the very traits that define it.
Familiarity doesn't explain itThe intuitive explanation is that we know more members of our own group, so we notice their differences. But studies have found the bias doesn't track how many people from each group someone actually knows, and it appears even between groups that mix all the time, such as men and women.
Rival explanationsSelf-categorisation researchers such as Alex Haslam argue the effect depends on context. When you're thinking in "us versus them" terms, you focus on what separates the groups, so the other side looks uniform; when you're thinking about your own group alone, you notice its internal differences. On this view it's a normal, flexible feature of perception rather than a fixed bias, and some researchers dispute calling it a bias at all.
Measuring "variety" is slipperyPerceived variability has at least two parts, how stereotypical a group is seen to be and how spread out its members are seen to be, and the effect is larger for the first than the second. Different measures can give different answers, which makes studies hard to compare.
The basic pattern, "they're all alike, we're all different", is well documented, and it sits comfortably alongside in-group favoritism. But it's modest in size, depends on context, and can reverse, so it's better seen as a tendency than a law.
Resources
Outgroup homogeneity bias, also called the outgroup homogeneity effect, is the tendency to see members of an outgroup (a social group you don't belong to) as more similar to one another than members of your ingroup (a group you do belong to) (Park & Rothbart, 1982). The result is a flattened picture of other groups that feeds oversimplification, stereotyping and misunderstanding.
The bias connects to several other principles and lines of research:
Ingroup favoritism: People tend to prefer members of their own group over those of an outgroup (Tajfel, 1982). Outgroup homogeneity can feed this preference by reinforcing stereotypes and the sense that ingroup members are more individual, and therefore more deserving of positive treatment.
Social identity theoryThis framework explains how people draw self-esteem and belonging from the groups they're part of (Tajfel & Turner, 1979). Seen through this lens, viewing outgroup members as interchangeable may help make one's own group feel more distinctive and valuable.
Stereotype formationStereotypes are generalised beliefs and expectations about social groups (Allport, 1954). If you assume everyone in an outgroup shares the same traits, beliefs or behaviours, you've done much of the work of building a stereotype already.
Cross-race effectPeople often find it harder to recognise and tell apart faces from other racial or ethnic groups, perceiving them as more similar than faces from their own group (Meissner & Brigham, 2001). Outgroup homogeneity bias may be one of the factors behind this effect.
Understanding the bias and its links to these principles can help researchers, decision-makers and everyone else notice and reduce its influence on judgments, decisions and everyday interactions.
References
- Allport, G. W. (1954). The nature of prejudice. Addison-Wesley.
- Meissner, C. A., & Brigham, J. C. (2001). Thirty years of investigating the own-race bias in memory for faces: A meta-analytic review. Psychology, Public Policy, and Law, 7(1), 3-35.
- Park, B., & Rothbart, M. (1982). Perception of out-group homogeneity and levels of social categorization: Memory for the subordinate attributes of in-group and out-group members. Journal of Personality and Social Psychology, 42(6), 1051-1068.
- Tajfel, H. (1982). Social psychology of intergroup relations. Annual Review of Psychology, 33, 1-39.
- Tajfel, H., & Turner, J. C. (1979). An integrative theory of intergroup conflict. In W. G. Austin & S. Worchel (Eds.), The social psychology of intergroup relations (pp. 33-47). Brooks/Cole.